This R Shiny web application allows to visualize the effect of a contact tracing
app to control SARS-CoV-2 epidemics. In particular, we show the results of
a proof-of-concept study in which a basic epidemiological model, accounting for asymptomatic infection
and population density, is informed about the use of a contact tracing app. Different illustrative scenarios can be
visualized by using the control panel on the left-hand side. A tutorial and details on the model are available
in the corresponding tab panels.
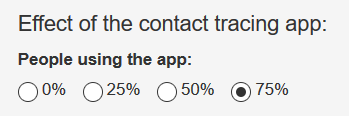
Each radio button on the left-hand side controls a selection of parameters related of the model. In particular,
results of simulations with different percentages of the population using the contact tracing app
can be visualized through the Effect of the contact tracing app panel. The curve
corresponding to the selected percentage will be highlighted in the visualization.
![]()
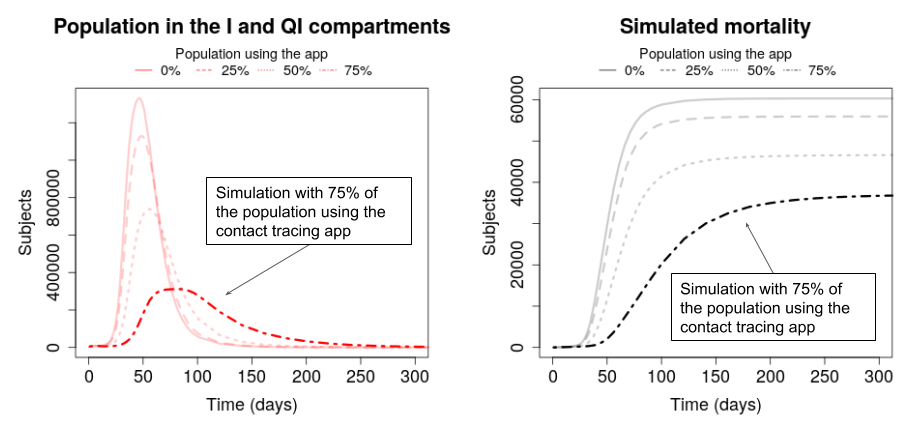
The visualization shows two plots representing the results of the simulations concerning the dynamics
of the population in the I (Infectious) and QI (Quarantined Infectious) compartments (red curves on the left)
as well as the dynamics of the overall mortality (black curves on the right).
![]()
The user can explore a number of illustrative scenarios by selecting combinations of parameters in the
Relevant demographic and epidemiological parameters panel. This selection of parameters include:
Population density:
it can be constant (1, 5 or 20 ppl/km², reflecting small, medium and large sized cities) or variable
(based on the actual Italian demography) for each node of the model.
Contact rate:
calculated based on
Rhodes & Anderson (2008), it can be pre-defined (7.5, 10, or 14.8, reflecting few, medium and many contacts) or
depending on a specified mobility (or velocity) (specifiy mobility).
Mobility:
it can be increased or reduced in a range (1.5, 2.5 or 5.2 km/day) based on estimations of the mobility
in Spain before and after the lockdown (14/03/2020).
As described in the Model tab panel, our model takes into account many other parameters whose values
are based on evidence in the literature. Nevertheless, it is important to stress that the current knowledge about SARS-CoV-2
infection and transmission is still characterized by many uncertainties. For this reason, we reckon that
a user-friendly platform with relevant control options is ideal to convery the main insights of our study.
We built a Susceptible-Infectious-Recovered (SIR) model with additional asymptomatic (A) and pre-symptomatic (P)
compartments and corresponding quarantine (Q*) compartments. In the following, we describe the model parameters
and the bibiographic sources. The structure of the model is shown below:
![]()
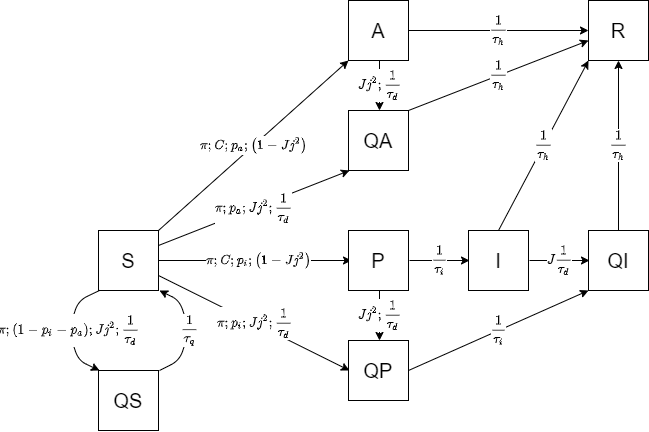
S individuals move to the A or P compartments with probabilities pa = 0.4 [1,2] and
pi = 1 - pa, respectively. P subjects move to I compartment after an incubation
period τi of 5.1 days [3].
The contact tracing app recommends voluntary quarantine to people
who had been in contact with a symptomatic case. As a J fraction of symptomatic cases are identified and quarantined
for a period τq of 15 days (based on WHO recommended 14-day quarantine), Jj2 is
the proportion of contacts that are sucessfully contained, when a j fraction of the population uses the app and self-quarantine
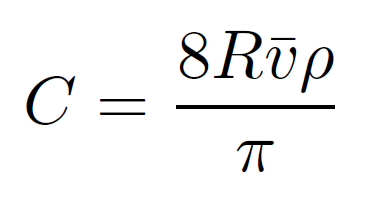
The contact rate C is parametrized to a population with density ρ moving with velocity v as in Rhodes & Andreson (2008) [4],
with infection transmission distance R equals to 1 meter [4]:
![]()
The model also includes the following additional parameters:
A and P subjects are less infectious than S subjects by a factor f = 0.10 [1].
P subjects are already infectious τd = 2 days before symptom onset [2].
Conctact rate C is reduced by a factor q = 0.1 during quarantine.
The probability of transmission in a single contact μ = 0.1 [1].
The overall mortality of symptomatic cases is 1%.
[1] Ferretti et al. Science (2020). DOI: 10.1126/science.abb6936
[2] He et al. Nature medicine (2020), DOI: 10.1038/s41591-020-0869-5
[3] Lauer et al. Annals of Internal Medicine (2020). DOI: 10.7326/M20-0504
[4] Rhodes and Anderson. Mathematical Biosciences (2008). DOI: 10.1016/j.mbs.2008.08
[5] Wells. American Journal of Epidemiology (1934). DOI: 10.1093/oxfordjournals.aje.a118097
The model was developed by Alberto Ferrari (Research Foundation, Papa Giovanni XXIII Hospital, Bergamo, Italy).
The research team that contributed to the work includes:
Enrico Santus (Bayer pharmaceuticals)
Davide Cirillo (Barcelona Supercomputing Center)
Miguel Ponce de León (Barcelona Supercomputing Center)
Alfonso Valencia (Barcelona Supercomputing Center)
Nicola Marino (Universitá di Foggia, Italy)
Maria Teresa Ferretti (Women's Brain Project)
Antonella Santuccione Chada (Women's Brain Project)
Nikolaos Mavridis (Interactive Robots and Media Laboratory, IRLM)
 COVID-19 contact tracing app simulator